This 3D Color Map of 1.7 Billion Stars in the Milky Way Is the Best Ever Made
BERLIN — Nearly 1.7 billion stars have been plotted in unprecedented detail with today's (April 25) highly anticipated release of data from the European Space Agency's Gaia spacecraft.
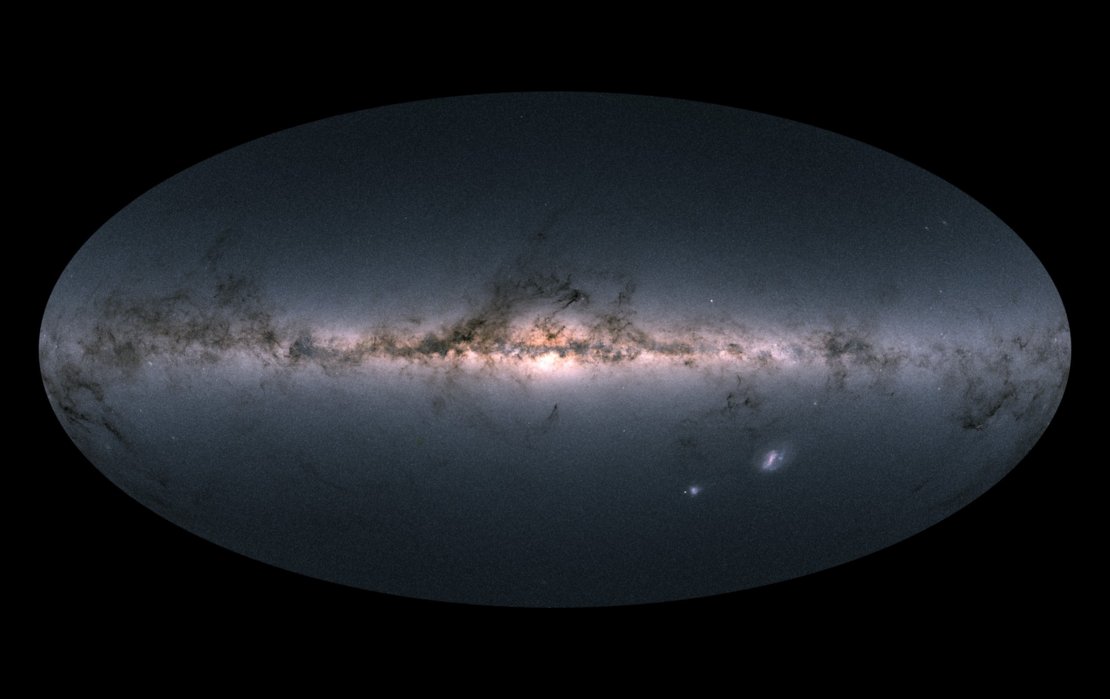
The new 3D map, which was unveiled here at the ILA Berlin Air Show, offers the best-ever look at the Milky Way — now in color — and promises to unleash hundreds of scientific discoveries about our galactic home and beyond.
"The first time I saw this I was at home, I turned off all the lights, and I just sat there in the dark for a while staring at this image because it's really so beautiful," Anthony Brown, an astronomer at Leiden University in the Netherlands, said during a press conference. Brown, who is chair of the consortium of 450 scientists and software engineers who are processing and validating the Gaia data, encouraged others to download the map and "go to a dark place and admire it." [How the Gaia Galaxy-Mapping Satellite Works (Infographic)]
The $1 billion (750 million euros) Gaia spacecraft launched in 2013 for a five-year mission to map the night sky with unmatched accuracy. The spacecraft is perched far beyond the moon's orbit, in the Lagrange-2, or L2, point, a gravitationally stable spot about 1 million miles (1.5 million kilometers) away from Earth. Unlike space telescopes such as Hubble that orbit the Earth, Gaia can scan the cosmos without Earth blocking a large chunk of its view. As it rotates in space, Gaia measures about 100,000 stars each minute and covers the whole sky in about two months. Each star is measured 70 times on average.
"Over the lifetime of five years of Gaia, we will actually get 29 independent measurements of whole sky," Günther Hasinger, the European Space Agency's (ESA) director of science, said at the ILA.
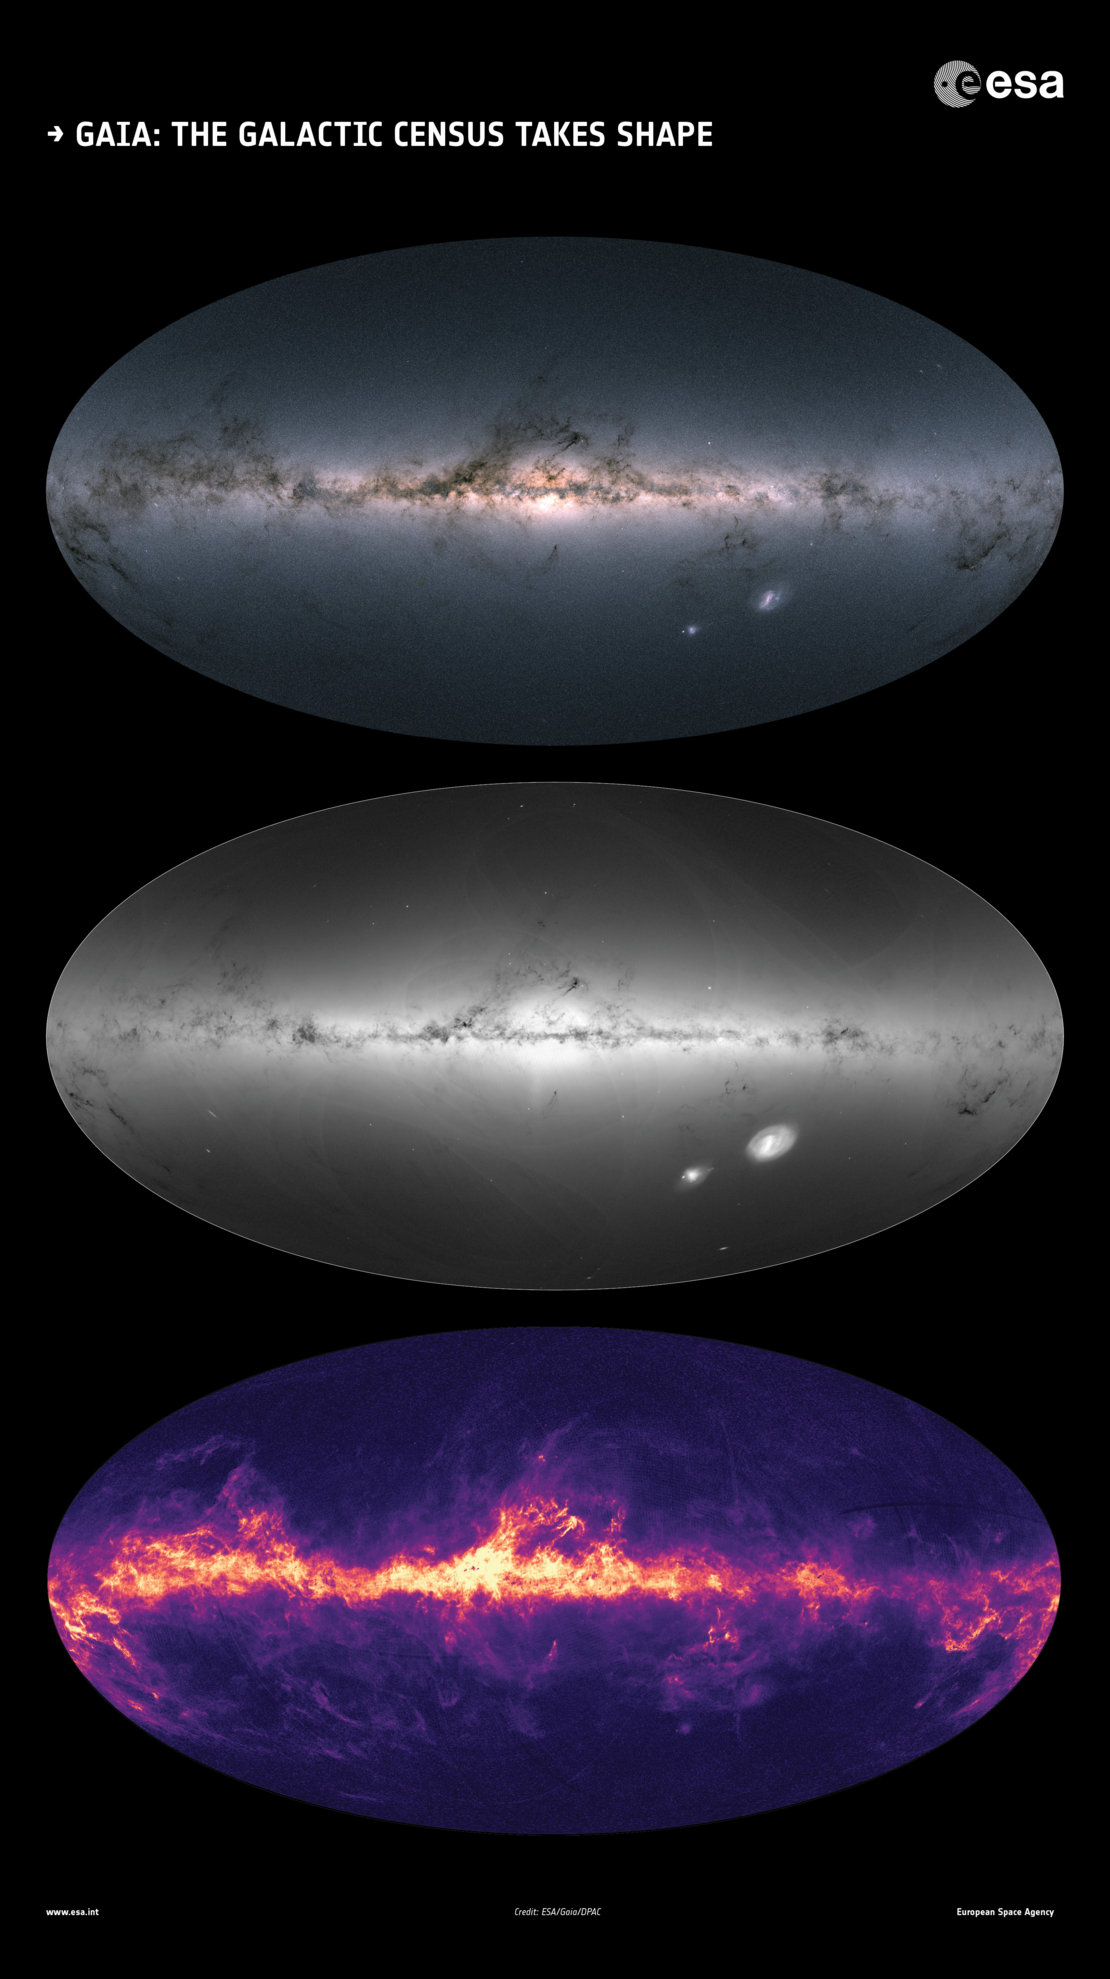
Gaia's first data release in 2016 offered information on the positions and brightness of 1.142 billion stars, but it included only the distances and motions of a subset of 2 million stars. The new publicly available catalog includes the positions, distances, motions, brightness and colors (which allowed the scientists to synthesize the new color image) of more than 1.3 billion stars. The star census also reveals the surface temperatures of about 100 million stars and the effect of interstellar dust on 87 million stars.
These measurements can be used for much more than Milky Way mapmaking. The properties of stars can tell scientists about the origins, evolution and structure of the galaxy. The Gaia scientists today announced some of their preliminary findings from poring over the new data. Independently, other teams of researchers around the world were eagerly waiting to get their hands on the data to run their own studies.
Breaking space news, the latest updates on rocket launches, skywatching events and more!
The huge trove of data went online at noon CET (6 a.m. EDT) and had 256 users in the first 2 minutes alone, according to a tweet from the Gaia mission. Brown told Space.com that he expects the first scientific manuscripts using the new Gaia data to be uploaded to preprint servers (such as arXiv) by tomorrow or Friday (April 26-27). An average of a paper a day had been published from the first Gaia data release until now, Brown said, and he expects there to be many more studies based on the new cache.
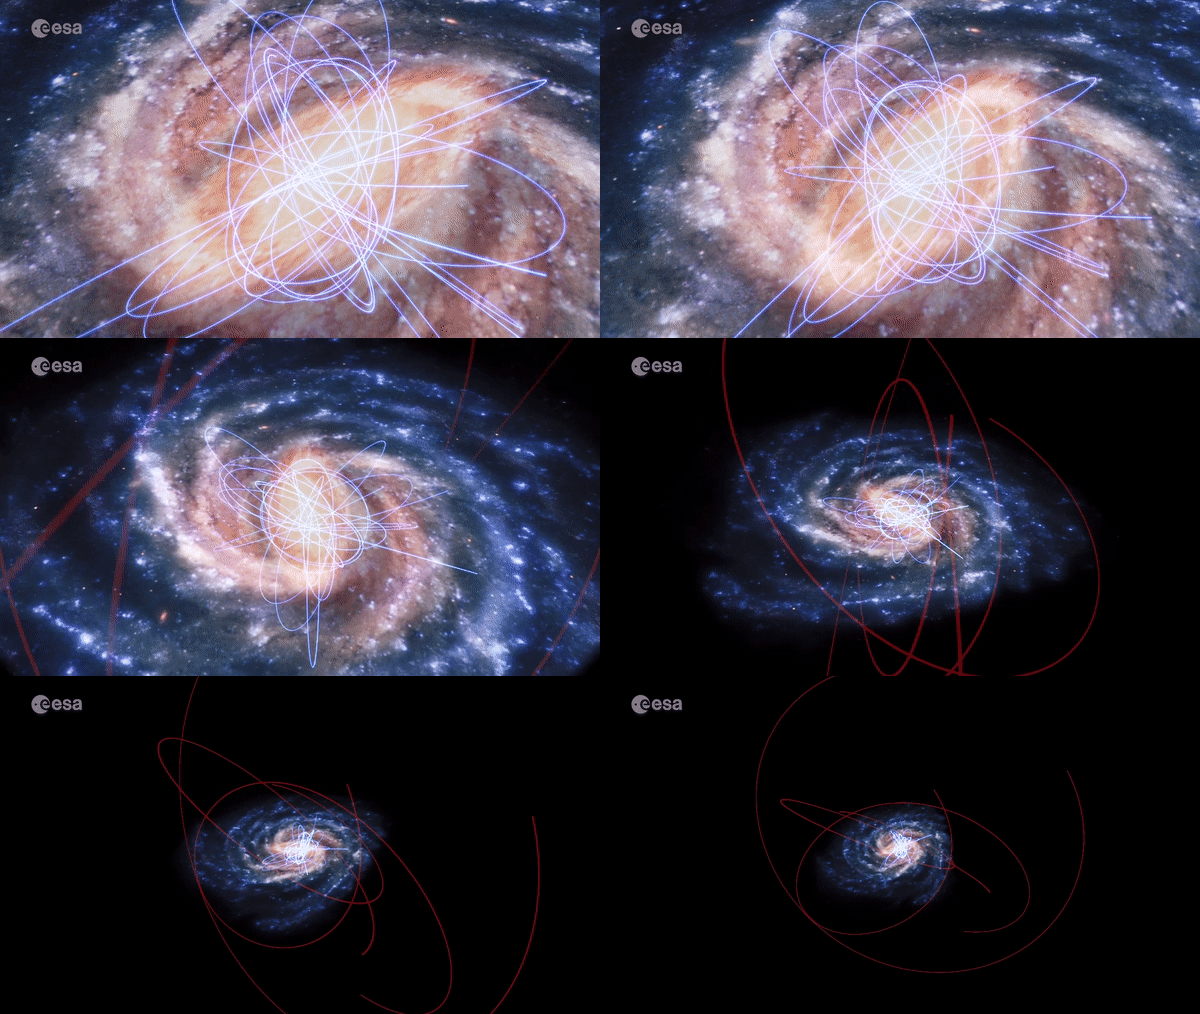
During today's release, Brown and his colleagues unveiled several images, including a new map of the clouds of gas and dust in the galaxy and a new visualization of the orbits of 75 ancient globular clusters and 12 dwarf galaxies that revolve around the Milky Way. The Gaia archive also contains the largest-ever radial velocity survey, with measurements on how fast more than 7 million stars are moving toward us or away from us, and the resulting map of this data was another "'Wow!' image" for Brown.
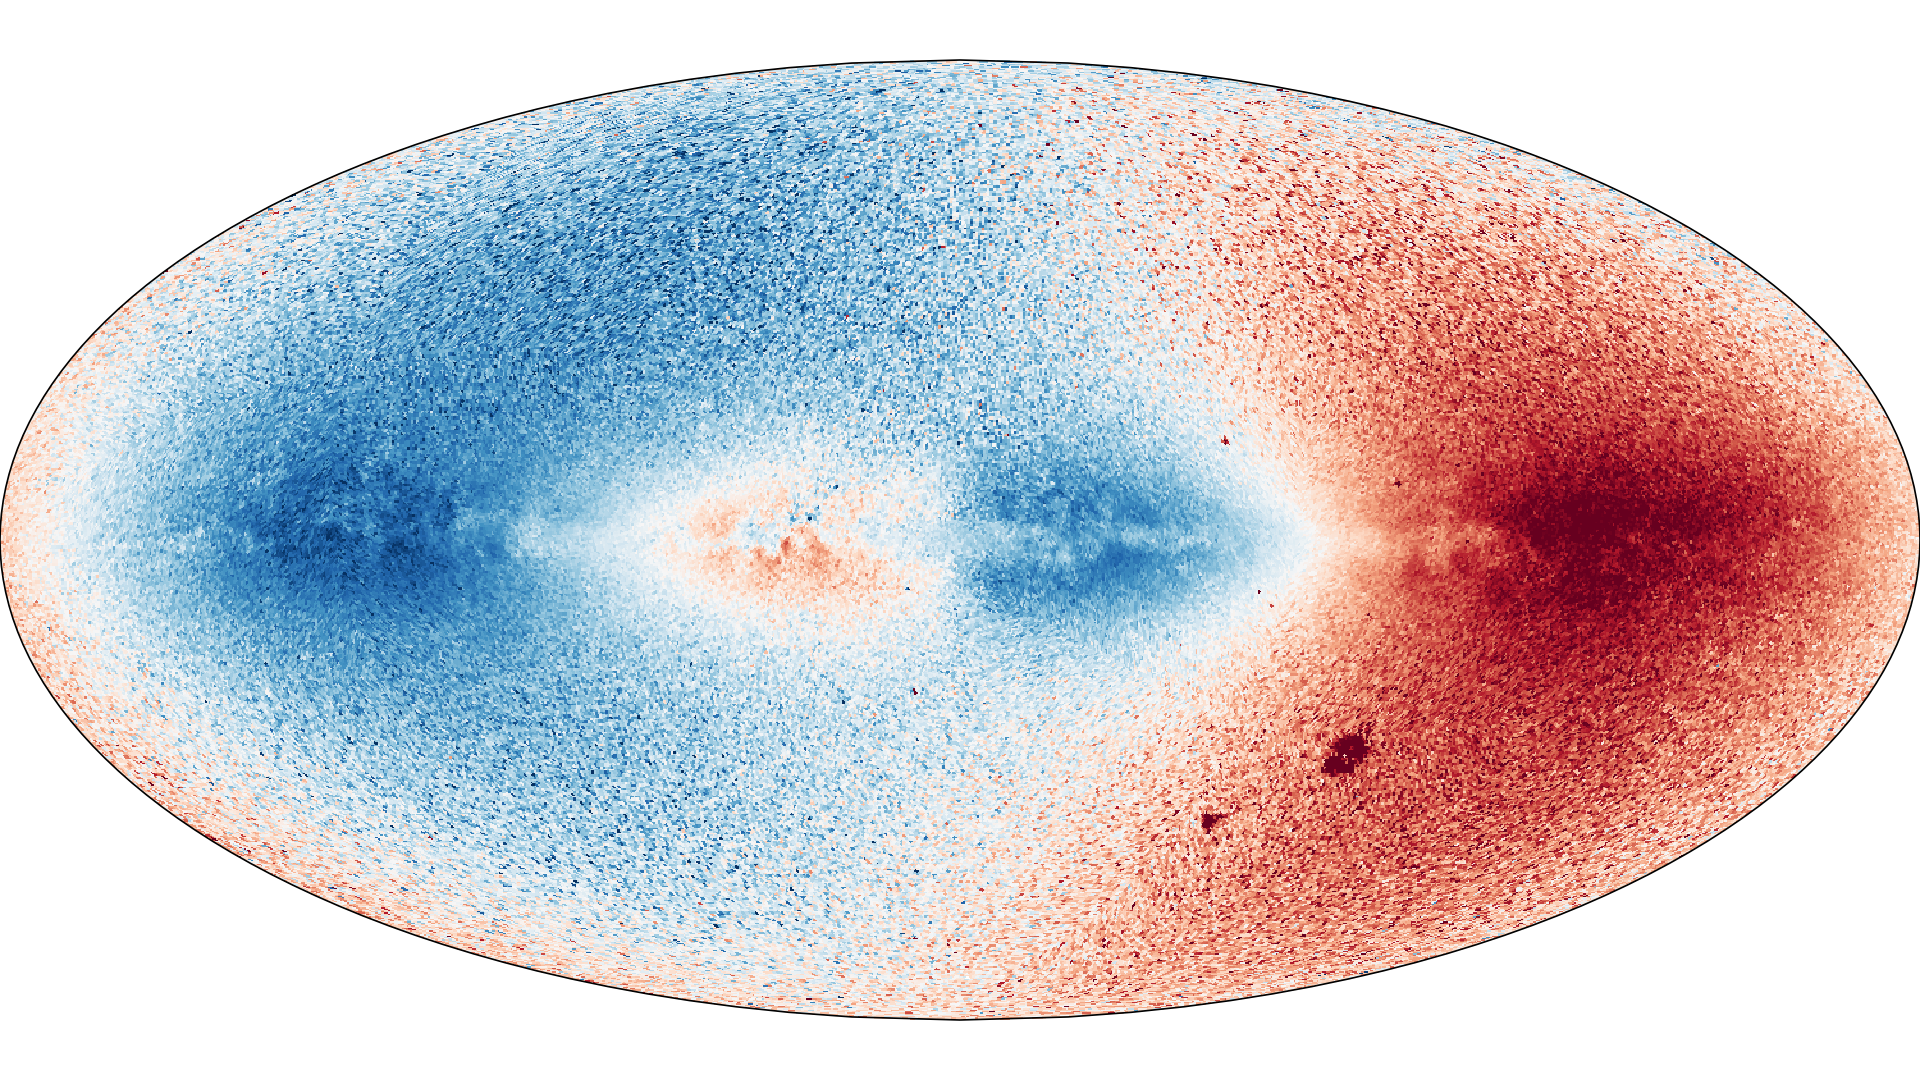
"Basically, you see the whole Milky Way in motion around its axis in this one image," he said.
Antonella Valenari, a Gaia scientist from the University of Padua in Italy, introduced a Hertzsprung-Russell diagram based on the new Gaia data. This type of diagram compares the brightness of stars with their color as a way to examine populations of stars and their evolution.
"In our Milky Way, we have different families of stars that are born more or less at the same time and more or less with the same chemical composition and same characteristics," Valenari explained, adding that reconstructing these families can help scientists understand when and how the Milky Way was formed. "For us this diagram is like opening a chocolate box. It's very, very exciting."
Valenari also said that the Gaia data reveals groups of stars "moving in a strange way" inside the Milky Way at similar speeds. She compared the pattern to ripples in a pond, and that smaller neighboring galaxies merging with the Milky Way billions of years ago might have caused this perturbation. "This is something we still have to study to be sure of it," she said.
The Gaia spacecraft has even made observations of our own solar system, mapping the positions of more than 14,000 known asteroids. And Gaia is still operating and collecting measurements. The final data release is expected for the 2020s, according to ESA.
Follow Megan Gannon @meganigannon, or Space.com @Spacedotcom. We're also on Facebook and Google+. Original article on Space.com.
Join our Space Forums to keep talking space on the latest missions, night sky and more! And if you have a news tip, correction or comment, let us know at: community@space.com.

Megan has been writing for Live Science and Space.com since 2012. Her interests range from archaeology to space exploration, and she has a bachelor's degree in English and art history from New York University. Megan spent two years as a reporter on the national desk at NewsCore. She has watched dinosaur auctions, witnessed rocket launches, licked ancient pottery sherds in Cyprus and flown in zero gravity on a Zero Gravity Corp. to follow students sparking weightless fires for science. Follow her on Twitter for her latest project.
